Today on Top 10 Excel features you need to know. I am a frequent visitor to StackOverflow to see what is troubling the Excel community (and other developer/analyst communities). It is nothing incredible that many users have issues due to not being aware of some of the most significant features in Excel like PivotTables, Array Formulas, Tables and other. I have seen more than once users reaching out to use VBA macros instead of much easier PivotTables/Charts. Although, I value VBA it should also be the solution of last resort compare to “native” Excel features used more common.
I have decided therefore to list some of the top 10 features regarded often as the most significant and useful to know. So let’s start with the 10 Top Excel Features…
No. 1: PivotTables
You can’t call yourself an advanced Excel user without knowing about PivotTables! There is no other feature in Excel I being used more often and with success. Almost the first thing I always do when analyzing data is pivot the data in multiple manners and analyze the patterns/results. Pivots can process a large amount of data in a short period of time and are optimized in the Excel back-end for performance. This is definitely one of the 10 top Excel features!
PivotTables allow you to transform and analyze data in a structure manner. Just select a range of data (data in columns with headers) and select the ROWS, COLUMNS and VALUES for your Pivot Table! You can also create custom columns (based on formulas), summarize data by groups/rows/columns etc. There is almost no limit in the possibilities.
How to find it in Excel? Insert->Tables->PivotTables
Filtering and sorting your data is just as useful as using PivotTables. Excel is meant to transform and analyze data and filtering/sorting is one of the key elements. When provided with a table of data you will probably want to sort the data in a descending/ascending manner or filter out rows based on some features (values in certain columns). This is a must-know feature.
If you want your data tables to be neat and structured you need to use Excel Data Tables. What do you get when using Tables in Excel? A consistent structure and formatting of your entire data table, automated copied formulas (across columns), non-repeating column headers and more. It is always good to resort to Excel Data Tables as you will have less work managing your data table and can focus on more interesting work like data transformation/analysis.
How to find it in Excel? Insert->Tables->Table
No. 4: Conditional formatting
Analyzing/transforming data is important, but it is just as useful to be able to identify variances in a range of values using graphics like colors, bars or icons. Conditional formatting can allow you to notice patterns in data values which might not be obvious when looking at raw numbers.
How to find it in Excel? Home->Styles->Conditional Formatting
No. 5: Lookup Excel functions
Although these functions are not exactly a separate feature they are considered to be one of the most useful and most often used when analyzing data. I can’t stress how often I stumbled upon articles/posts about these functions. These functions are also frequently used by recruiters for Excel jobs.
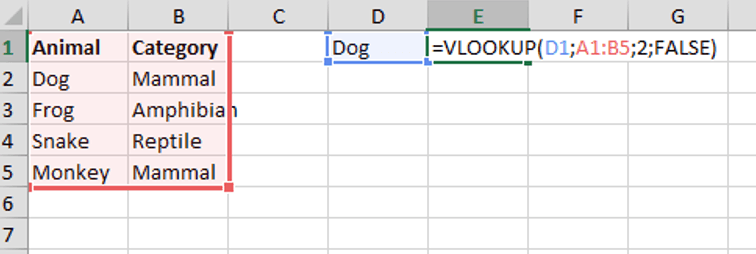
VLOOKUP – search the first column of a range of cells, and then return a value from any cell on the same row of the range
HLOOKUP – as above but for columns instead of rows
INDEX – returns the value of an element in a table or an array, selected by provided index
MATCH – searches for a specified item in a range of cells, and then returns the relative position of that item in the range
How to use these functions?
The VLOOKUP function will return a corresponding value from another cell of the same row of a value found in the first column of the data table.
The INDEX and MATCH functions are best to be used together (see the links section below). Why? They allow you to basically achieve the same result as the LOOKUP functions HOWEVER these are more flexible. I encourage you to read the links below.
Array Formulas are one of the greatest knowledge gaps in the Excel community in my opinion. I see so often questions which can be easily answered if someone at least made an effort to learn them. Many Excel users fall into the trap of writing a lot of custom VBA just because they are not aware or are too lazy to use a neat Array Formula.
How to use Array Functions?
Go to the links section for a decent tutorial. However, the process itself is quite simple:
Create a function using an Excel range e.g. A1:A10
So easy and yet so powerful! Let’s jump into a simple example:
Excel Array Formula Example
Let’s assume we have a range of value for a certain period of time. We want to get the maximum value for dates after the 1st of March 2015. We can get this in a single Array Formula! See below.
How does it work?
'MAX ( returns all cells from A2:A8 for which B2:B8 are older than 2015-03-01)
=MAX(IF(B$2:B$8>DATE(2015;3;1);A$2:A$8))
See the logic? You can also multiply/divide/sum and do other cool thing with Array Formulas. See the tutorial link below.
All tools needed in doing basic data cleansing can be found in the Data Tools section of the Data ribbon. Working on data often? You need to know how and when to use Text to Columns, Data Validation and all the other neat tools.
Naming cells/ranges comes in handy when you repeatedly reference certain cells or arrays e.g. USD/EUR currency field, interest rate used in formulas etc. This is a nice and clean way to manage all reference to those fields and allows you to easily relocate these cells or ranges.
How to set a Defined Name to an Excel cell/range?
Click on the text field in the upper-left with the cell/range reference
Type in Defined Name for this cell/range – it must not have whitespaces
Hit ENTER
Now when trying to reference the cell/range in a formula simply type the new Defined Name.
How to find it in Excel? Formulas->Defined Names
No. 9: VBA macros and recording macros
The reason VBA is placed before last on the 10 Top Excel features list is because, in my opinion, it is so often abused but users who refuse to learn well the remaining Excel features. VBA macros fills the gap of all the missing features/functions in Excel. Macros let’s you program almost anything in Excel, you name it – forms, database connectivity, analytics, web browsing etc. You can’t basically consider yourself an Excel Pro without being able to program macros in VBA. However, it is important to stress that the problem with VBA is that once learned it tends to make analysts lazy – instead of Excel Array Formulas you will see custom macros or hideous UDF-functions. VBA should be used as a tool of last resort!
Typical applications of VBA
Cleansing/filtering/sorting/copying data
Custom algorithms (custom analysis of data sets)
Custom Excel UDF functions (User Defined Functions)
Excel Forms (making custom user forms to input data or create a custom UI)
How to find it in Excel? Developer->Code->Visual Basic Recording macros The other fantastic thing with Excel is that it enables you to record macros – by recording your actions in Excel and translating them into VBA code. In some cases you need not even understand the code to be able to reuse it e.g. applying custom formatting to selected cells. This is definitely a great feature on it’s own.
How to find it in Excel? Developer->Code->Record Macro
No. 10: Microsoft Power Add-In’s
Last but not least on the 10 Top Excel features list are the PowerPivot, PowerQuery and PowerMap powerful Microsoft developed Add-Ins for Excel. Harness the power of Big Data, SQL, complex pivots and charts with these fantastic Add-ins! The PowerMap is a relatively new member of the family delivering nice bells and whistles to your Workbooks!
PowerPivot basically pumps Excel with more Analytics features by extend the PivotTable with summarization, cross-tabulation, expanded data capacity, advanced calculations, ability to import data from multiple sources, and the ability to publish the workbooks as interactive web applications.
PowerQuery will allow you to easily harness data and access to external data sources such as files, the Web, databases etc. and more easily manipulate and cleanse data. PowerQuery enables you to process enormous data sources/tables counting millions of records (more than an Excel Worksheet can contain).
PowerMap (as quoted on the official MS site) is a three-dimensional (3-D) data visualization tool that lets you look at information in new ways. A power map lets you discover insights you might not see in traditional two-dimensional (2-D) tables and charts.
Both these tools complete one another. If you want to do Business Intelligence in Excel you need to be able to use both these Add-Ins. Microsoft seems to have great plans for them and I would anticipate that both these Add-Ins become a “native” part of Excel in the following versions of Microsoft Excel.
 Although these functions are not exactly a separate feature they are considered to be one of the most useful and most often used when analyzing data. I can’t stress how often I stumbled upon articles/posts about these functions. These functions are also frequently used by recruiters for Excel jobs.
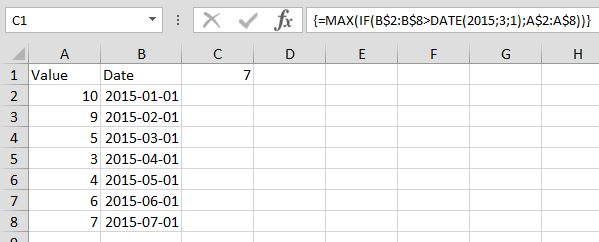
 Last but not least on the 10 Top Excel features list are the PowerPivot, PowerQuery and PowerMap powerful Microsoft developed Add-Ins for Excel. Harness the power of Big Data, SQL, complex pivots and charts with these fantastic Add-ins! The PowerMap is a relatively new member of the family delivering nice bells and whistles to your Workbooks!